 ← inventory
Amazon Purchase Histories from US Consumers
Amazon Purchase Histories from US
Consumers spanning 2018 - 2022
This is a first-of-its-kind open dataset of Amazon purchase histories crowdsourced from over
5000 US consumers.
Academics have begun using this data for research and we invite the artist community to use
the data as well.
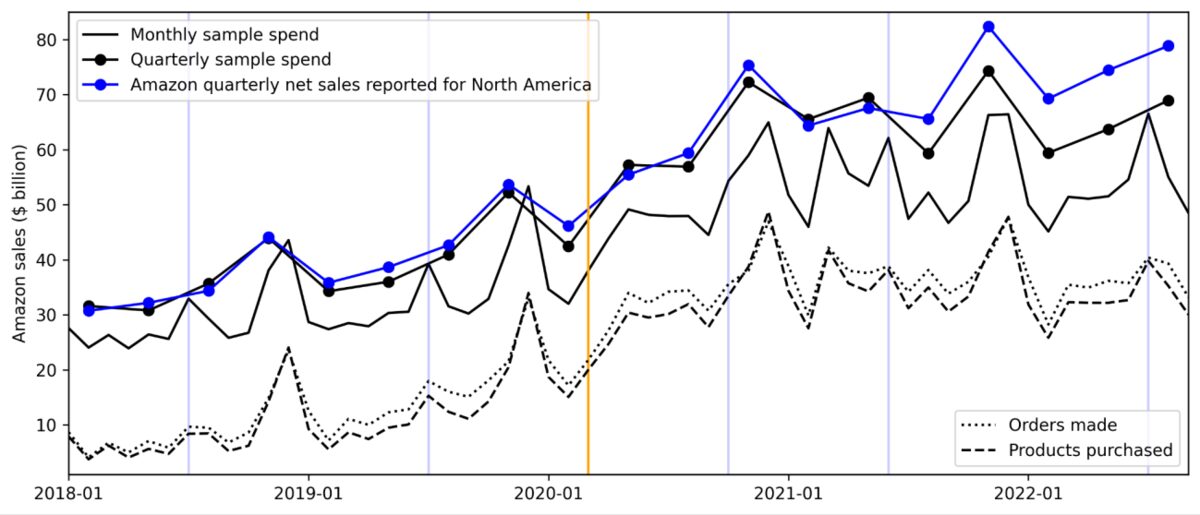
Figure: Quarterly Amazon net sales (North America segment) reported for investor relations compared to
metrics computed from our sample. Light blue lines indicate months Amazon Prime Day occurred. The
orange line indicates March 2020, when COVID-19 had a major impact on US consumption.